You want to understand your data, build insights, and optimize your budget. But are you really seeing and understanding your data if you don’t know what you’re looking at?
Let’s look at an example. The NCAA basketball tournament wrapped up in March. Let’s pretend you’re a car company that ran some display and video ads during this time. Here are a few mock creative names you might see:
- Creative Name 1: 160x600_na_us_na_cam_987410_sed_eng_hth_na
- Creative Name 2: 160x600_na_us_na_cam_421932_suv_eng_ora_na
- Creative Name 3: 15s_vid_us_na_cam_082310_sed_eng_rmr_04.02.25
- Creative Name 4: 160x600_na_us_na_cam_421932_cou_eng_grg_na
Sifting through these, we can only infer that they ran in the US, are in English, feature different vehicle styles, and that one is a video—but we have no idea what the actual creatives look like.
To know for certain, you need to manually dig up the creative name, match that name to its file name, find that creative name in your data, pull the performance data, and then copy & paste it next to the image. It sounds straightforward, but this requires a lot of effort, with a lot of back-and-forth between marketing, creative, and analytics teams. This isn’t scalable when you must repeat it every time, leading to inefficiencies and delays.
It’s Time Creative Reporting Has Creative Assets
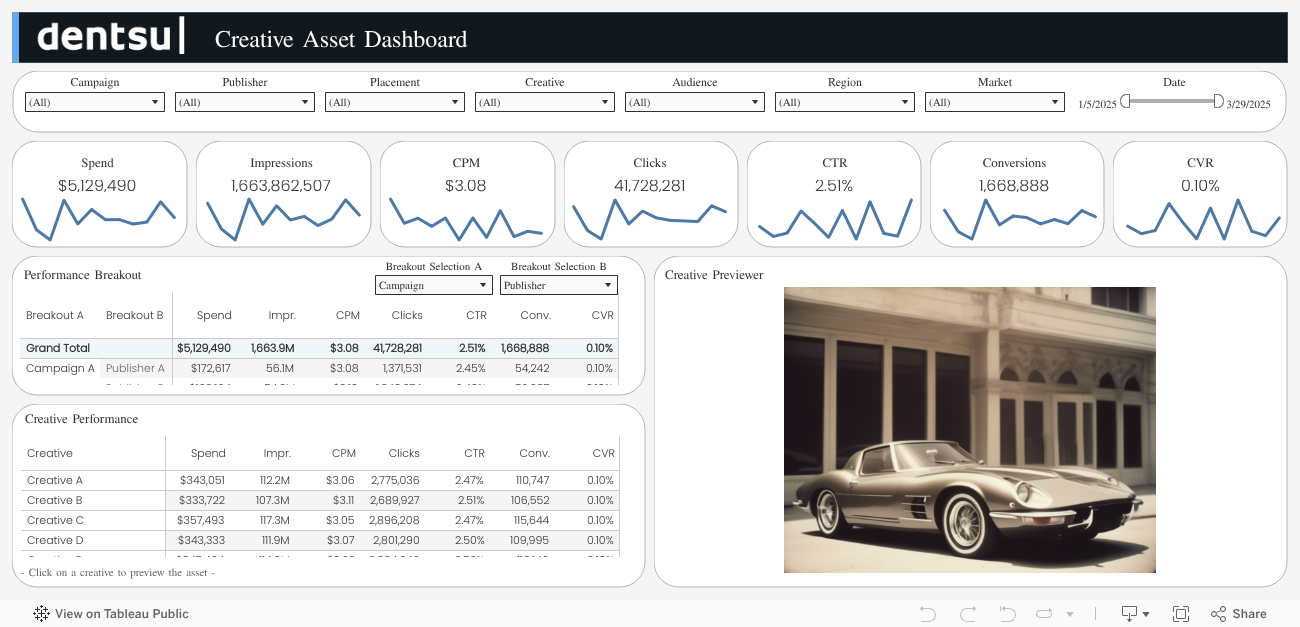
It’s time you had an automated dashboard that saves you from all the tedious work of mapping images to data. It’s time to put an end to manual creative reporting. It’s time images and videos are data points instead of just screenshots in a PowerPoint. See the dashboard in action, explore our demo version below.
In the same way your ads resonate with your audience, you will start connecting with your data. You get to see your creative in your data. Isn’t that the whole point of advertising? You know exactly what you’re looking at. When all you have is an unintelligible, underscore-heavy “Creative Name,” a picture is now worth more than a thousand words.
A New Era of Efficiency and Insight
By integrating images directly into the dashboard, analysts can focus on tasks that truly matter, driving efficiency and enhancing content processes.
Quick Identification and Analysis: With less time spent on manual data entry, you free up valuable resources to focus on understanding which creative assets perform best and why.
Improved Cross-Creative Comparison: With visual context, it's easier to identify trends—such as color schemes, design choices, or calls to action—that may impact the effectiveness of different assets. This leads to more data-driven decisions and more effective ad strategies.
Real-Time Performance Insights: Analysts can immediately see how different designs are impacting metrics such as conversion rates, engagement, and click-throughs. This means faster optimizations, helping your business stay ahead of the competition.
- Enhanced Storytelling: Visualized data makes it easier for analysts to tell a compelling story to stakeholders. It allows them to clearly demonstrate which creative elements are driving success, showcasing the impact of specific design choices on ROAS. This leads to more effective communication with decision-makers, who can now see the full picture (literally!).
How This Translates to Value for Businesses
This is not just an efficiency play for analysts; it's a value add for businesses across the board. It echoes the pillars of a strong content supply chain via:
Faster Decision-Making: With creative assets and performance data in one place, businesses can make quicker decisions. Ad campaigns can be optimized in real time, minimizing wasted spend and maximizing ROAS.
Increased Collaboration: Teams across the company—creative, marketing, and analytics—can work together seamlessly. With everything integrated into one system, there’s no need to communicate across platforms or send files back and forth. Insights are accessible to everyone in real time, helping to drive more coordinated and aligned efforts.
Cost Savings: Automating manual tasks means less time spent on repetitive processes. Businesses save on labor costs, allowing that budget to be better allocated to other growth-driving initiatives, such as optimizing ad spend or enhancing creative quality.
- Scalable Reporting: The ability to add more creative assets without the burden of extra manual effort ensures that performance reporting can keep up with the growing volume of ads and data. What once took hours can now be done in minutes, allowing for scalable processes that evolve with your business.
You Might Be Asking Yourself…
“Is it secure?” Of course. Security is our top priority. The images are only accessible in the dashboard via multi-factor authentication.
“Are our naming conventions too complex to do this?” That’s where we thrive. The backend tool aligns file names to creative trafficking names, doing the mapping for you.
“What about videos?” Just click play.
“What about carousel ads with multiple creative assets?” No sweat, scroll through them.
“What about different file formats (png, jpg, mp4, etc.)?” That was easy.
- “What about different reporting tools? Tableau? PowerBI? Looker? Etc?” It’s flexible to meet your reporting requirements.
Advertising is Visual—Visualize Your Ads with Your Data.
This approach changes the way you’ll look at creative reporting going forward. No longer will you be comparing unrecognizable naming conventions; you’ll now be comparing images that need no context. But even if you do need some context, it’s all there in the data — just as it was before.
See for yourself in our demo version. Click on a creative asset in the table and watch it pop up in the viewer.


